We released an extended version of our original dataset! Learn more about the Incidents1M Dataset in our latest paper here. The dataset is now multi-label, and we present more analysis and experiments than our original ECCV 2020 paper. Note: this project page has not yet been updated to reflect the improvements! Please see the paper for now.
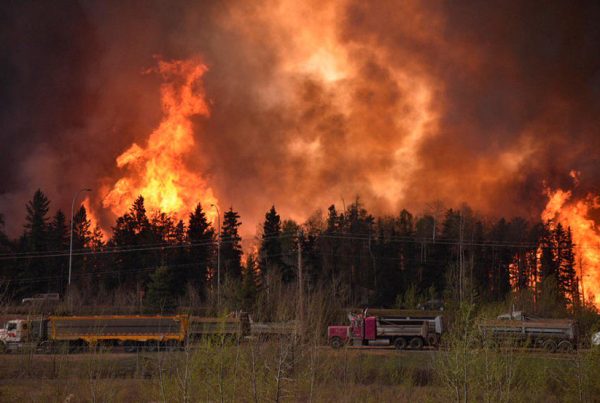
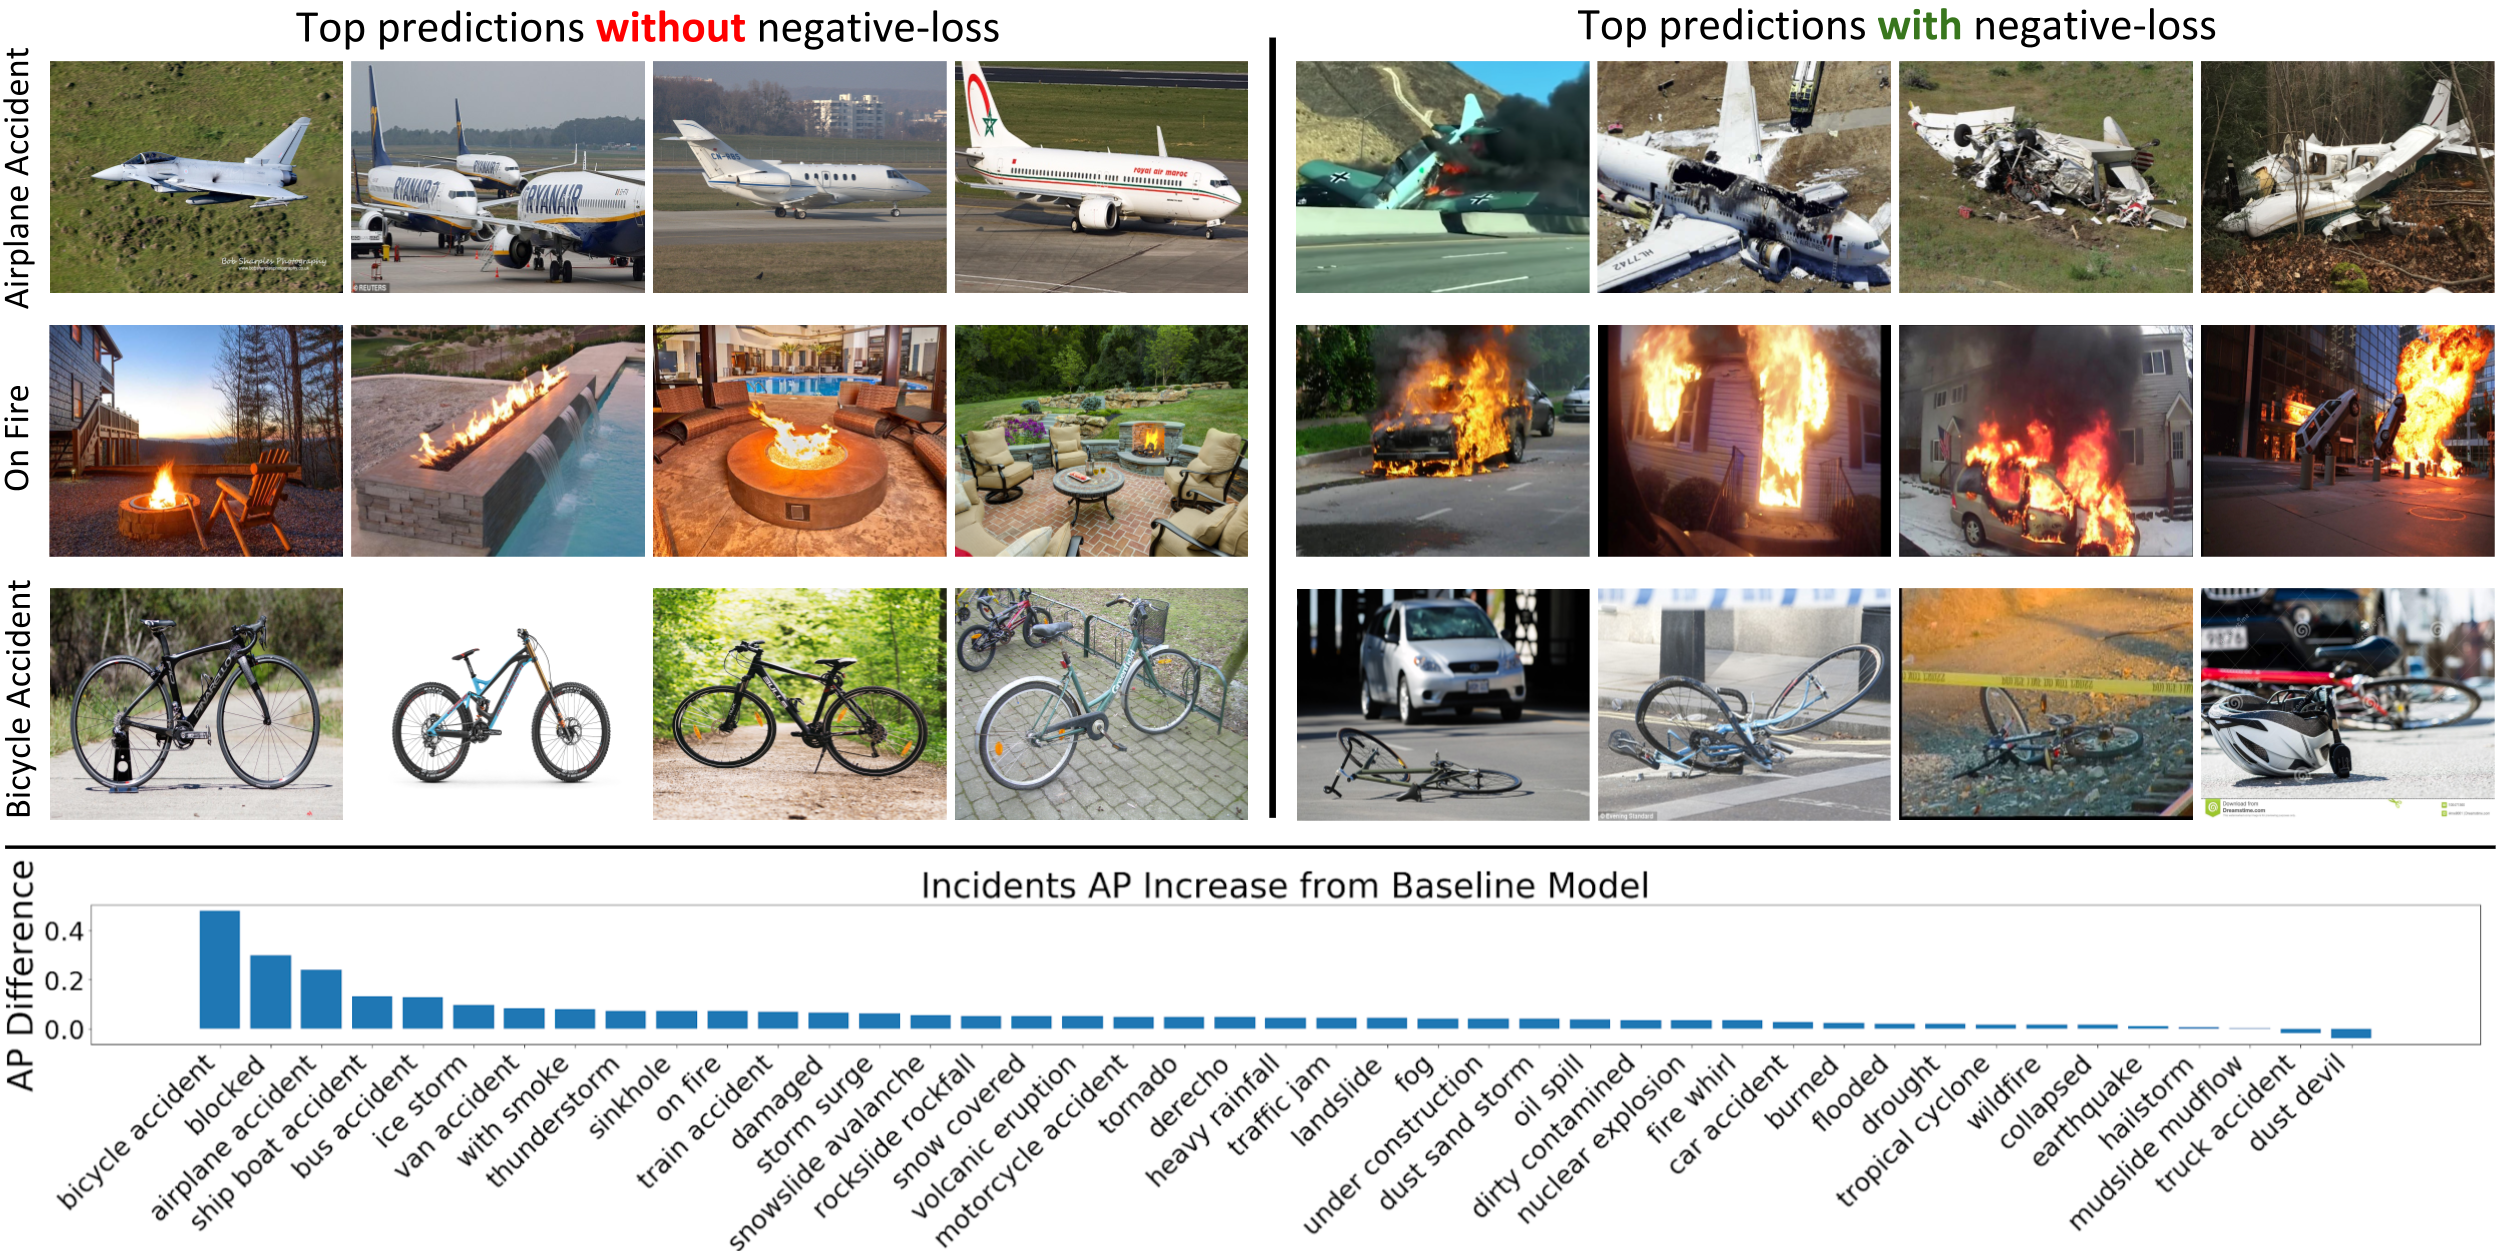
Responding to natural disasters, such as earthquakes, floods, and wildfires, is a laborious task performed by on-the-ground emergency responders and analysts. Social media has emerged as a low-latency data source to quickly understand disaster situations. While most studies on social media are limited to text, images offer more information for understanding disaster and incident scenes. However, no large-scale image datasets for incident detection exists. In this work, we present the Incidents Dataset, which contains 446,684 images annotated by humans that cover 43 incidents across a variety of scenes. We employ a baseline classification model that mitigates false-positive errors and we perform image filtering experiments on millions of social media images from Flickr and Twitter. Through these experiments, we show how the Incidents Dataset can be used to detect images with incidents in the wild.
Use the following links for access to the paper, code, and data. The GitHub page contains code and final model weights, along with an explanation of how to use it. It also includes instructions for downloading the dataset.
@InProceedings{weber2020eccv,
    title={Detecting natural disasters, damage, and incidents in the wild},
    author={Weber, Ethan and Marzo, Nuria and Papadopoulos, Dim P. and Biswas, Aritro and
    Lapedriza, Agata and Ofli, Ferda and Imran, Muhammad and Torralba, Antonio},
    booktitle={The European Conference on Computer Vision (ECCV)},
    month = {August},
    year={2020}
}
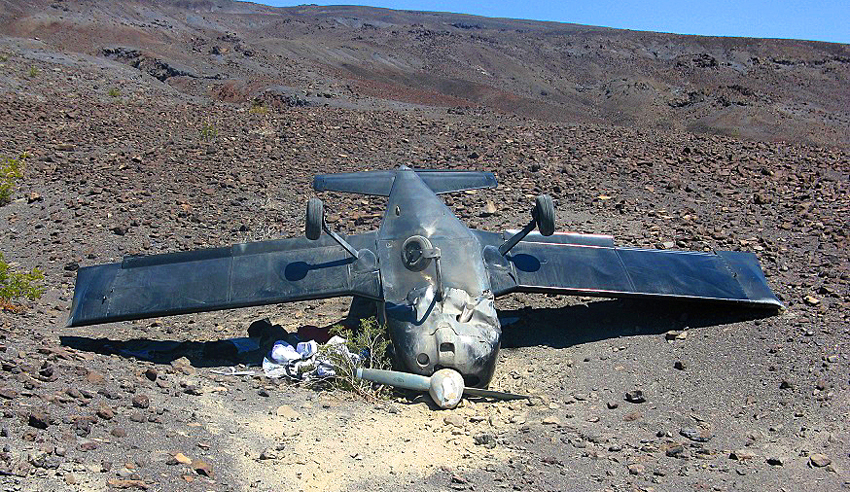
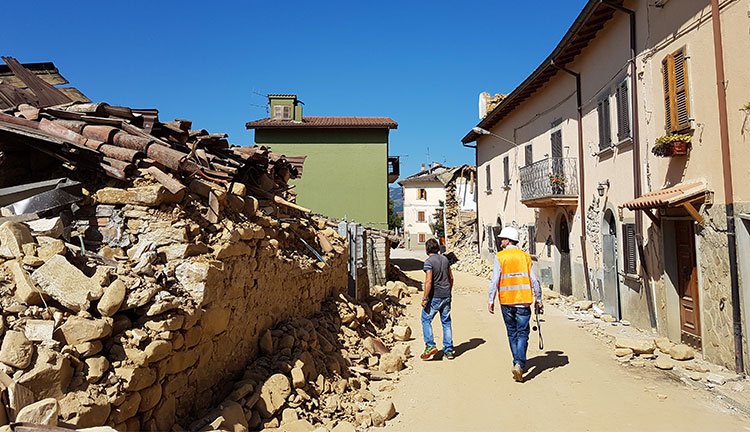
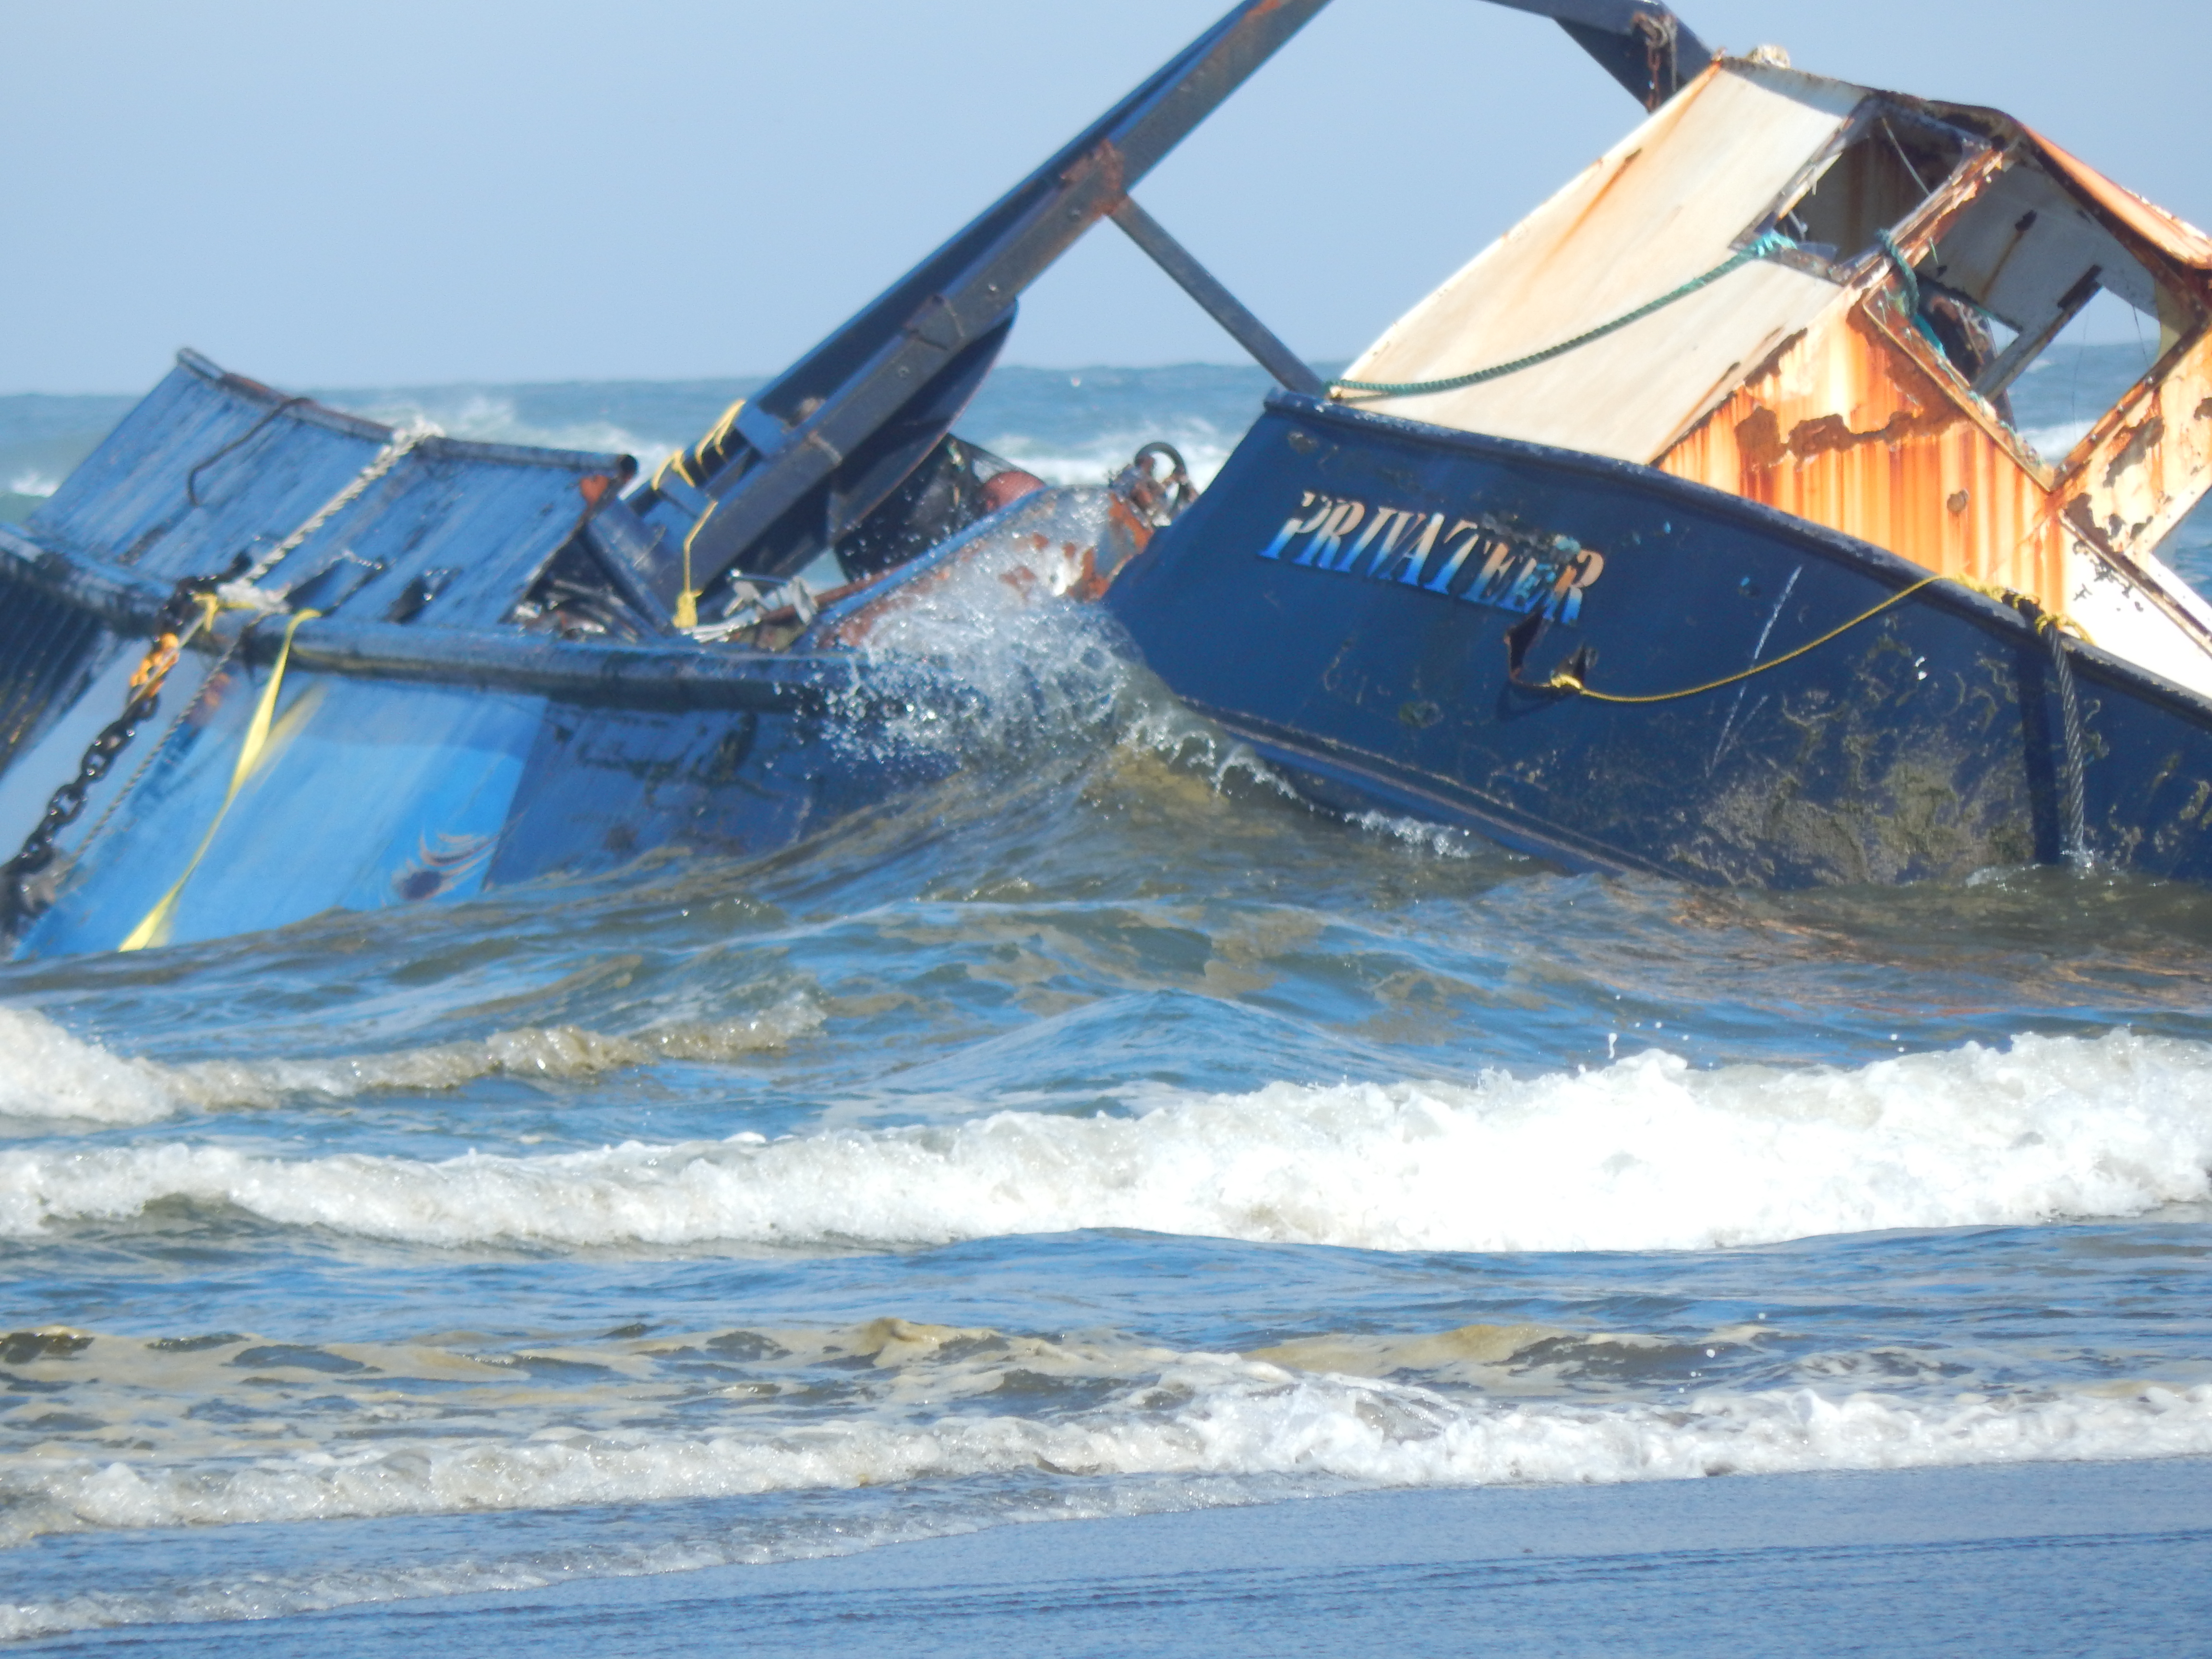
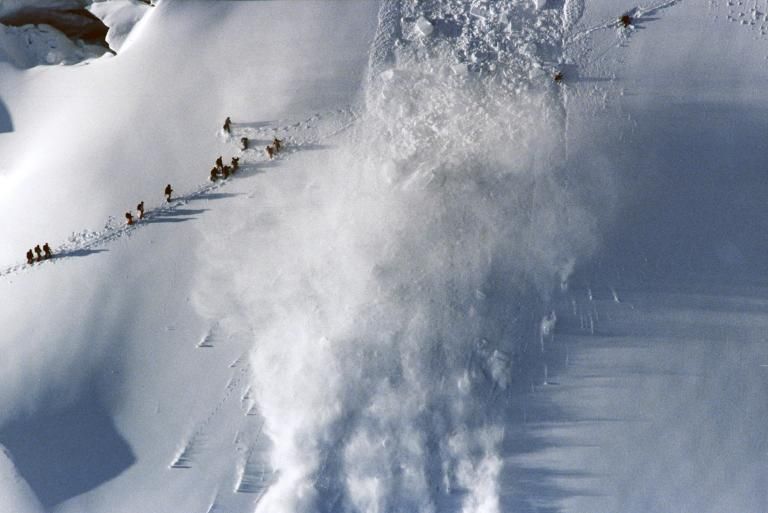
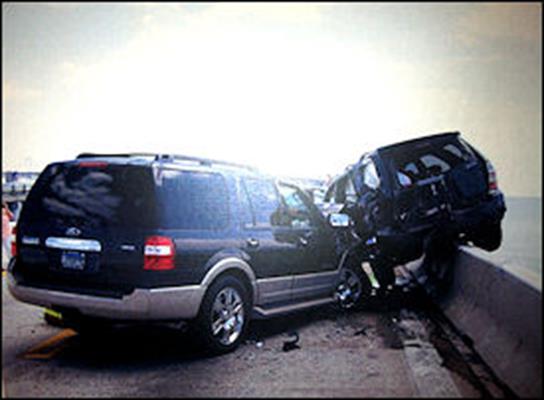
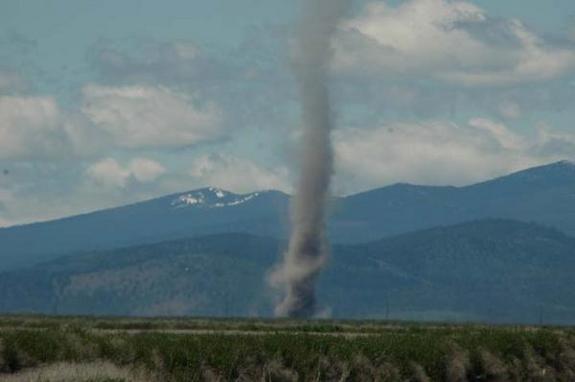
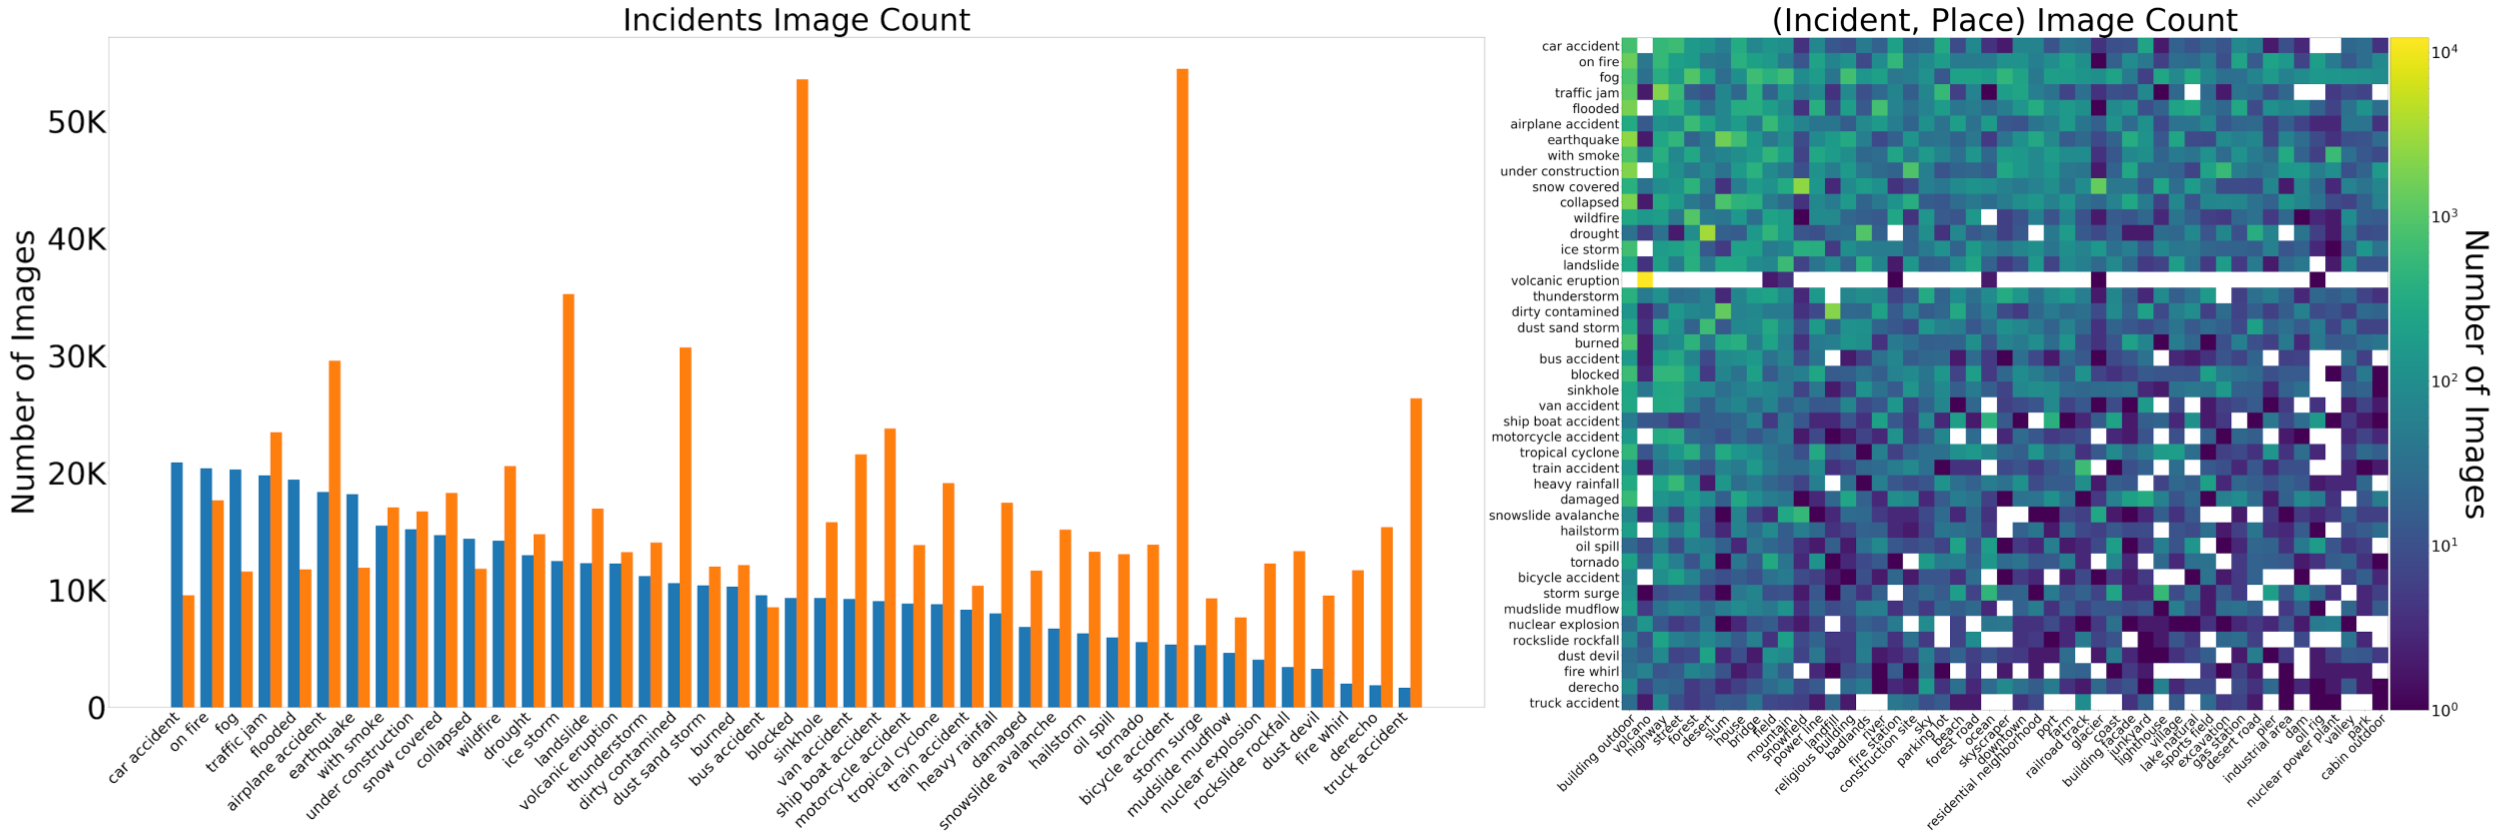
The large-scale Incidents Dataset consists of 446,684 scene-centric class-positive images (annotated by humans) related to natural disasters, types of damage or specific events that can require human attention or assistance, like traffic jams or car accidents. We use the term incidents to refer to the 43 categories covered by our dataset. 49 places are used to add diversity to the images. An additional set of 697,464 class-negative images are part of the dataset and used to train our final model to mitigate false-positive predictions. See the paper for more details.
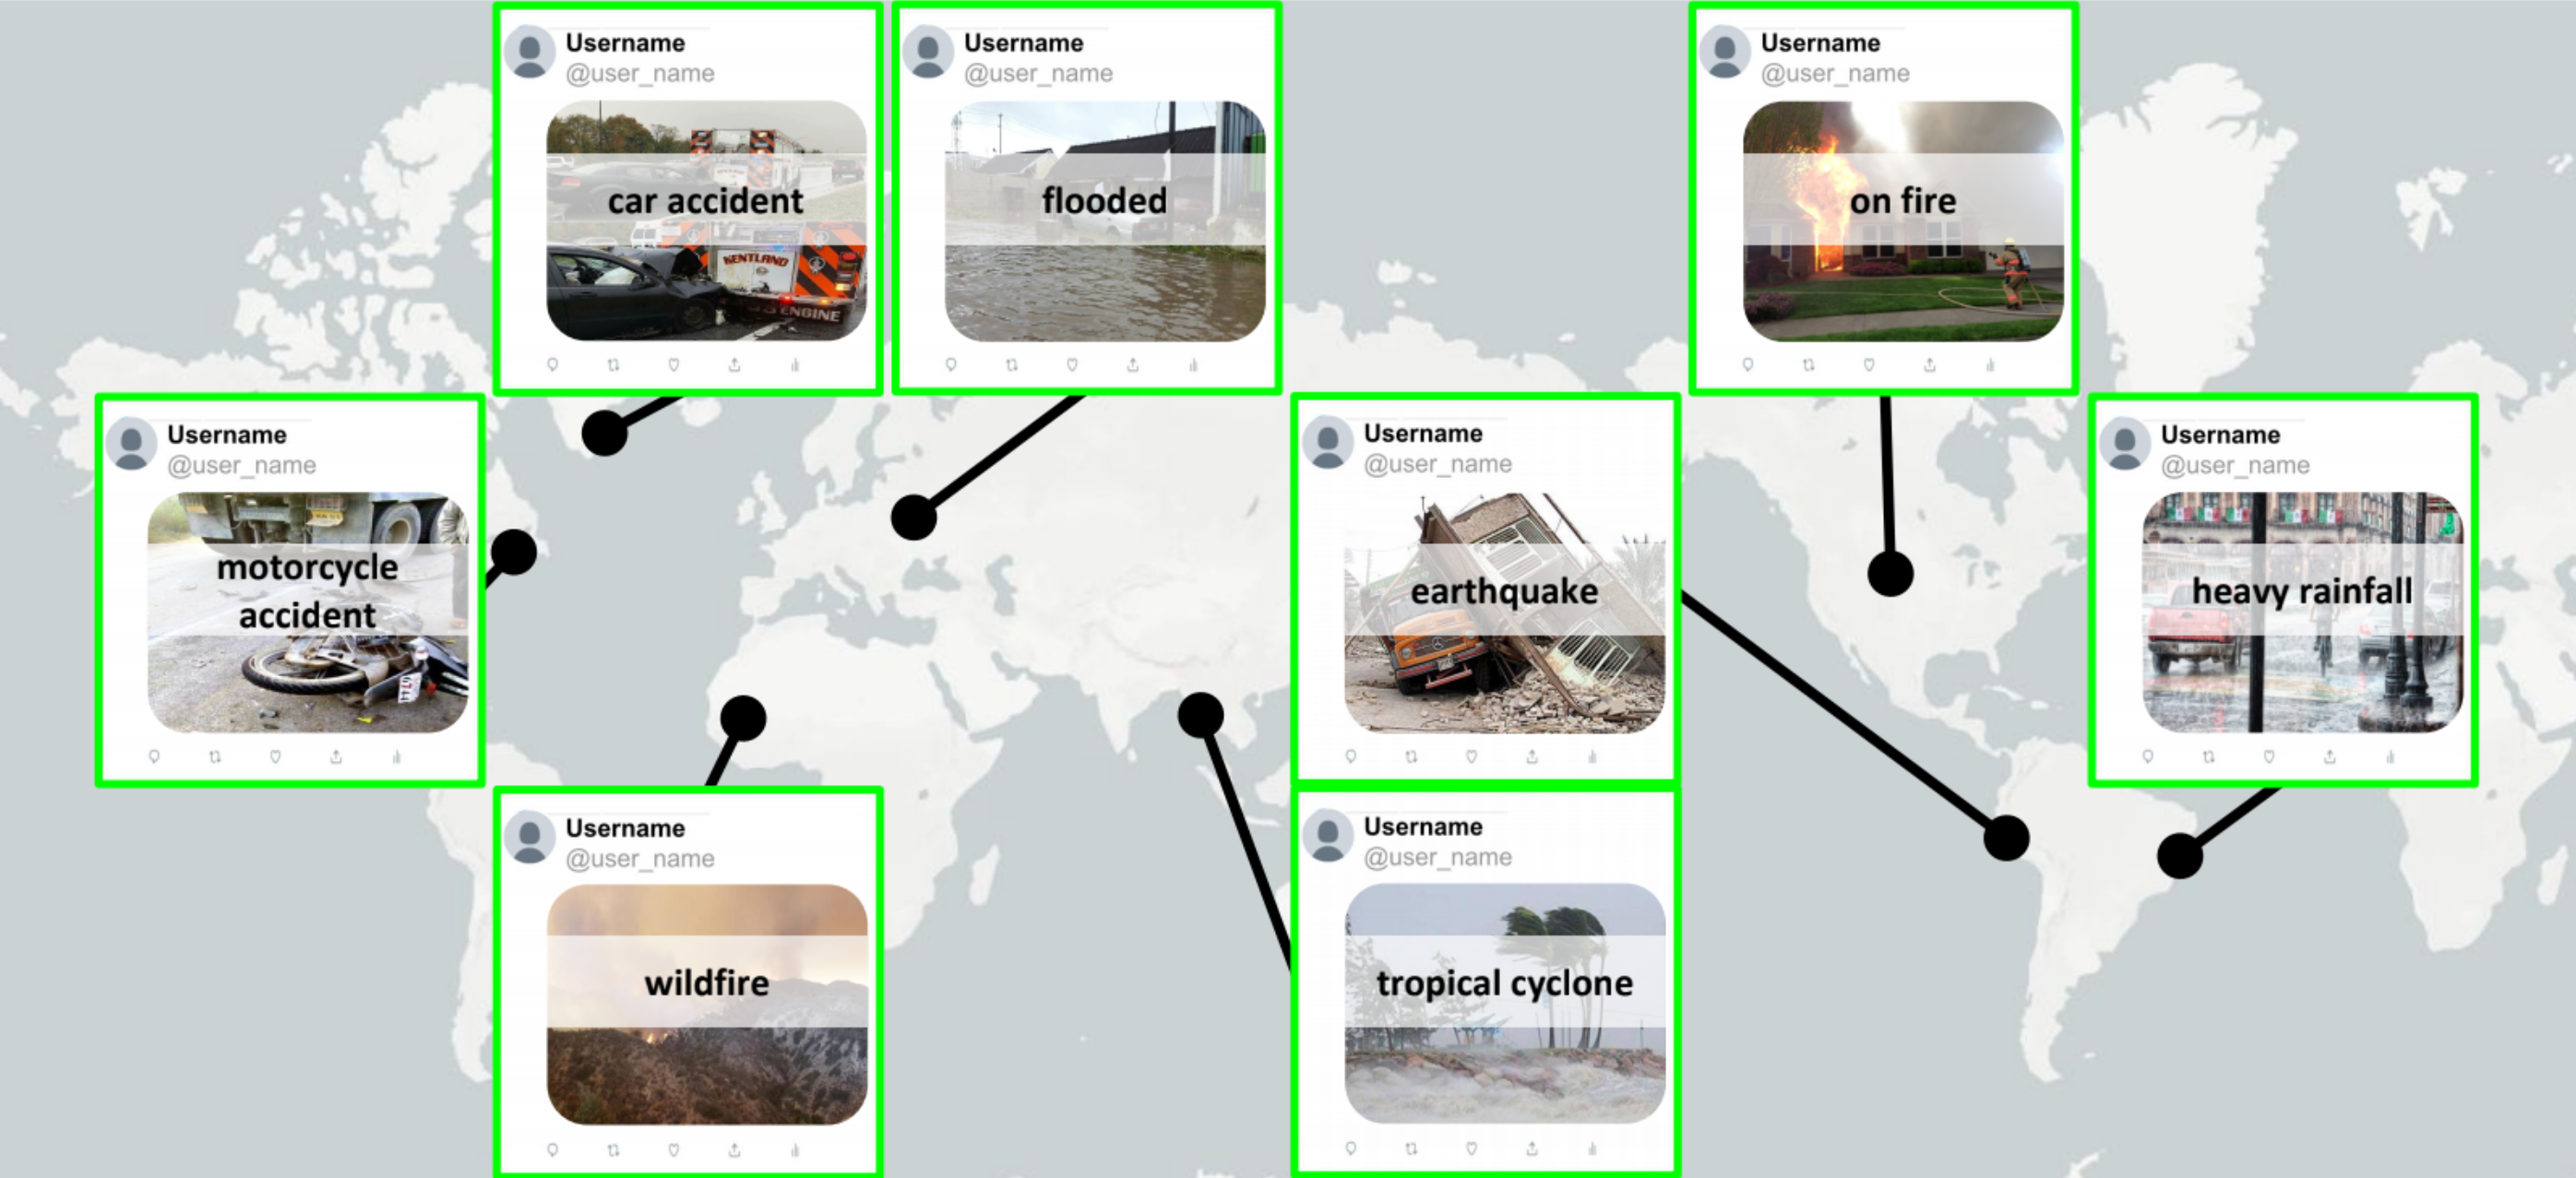
Below we show some example images from the dataset:
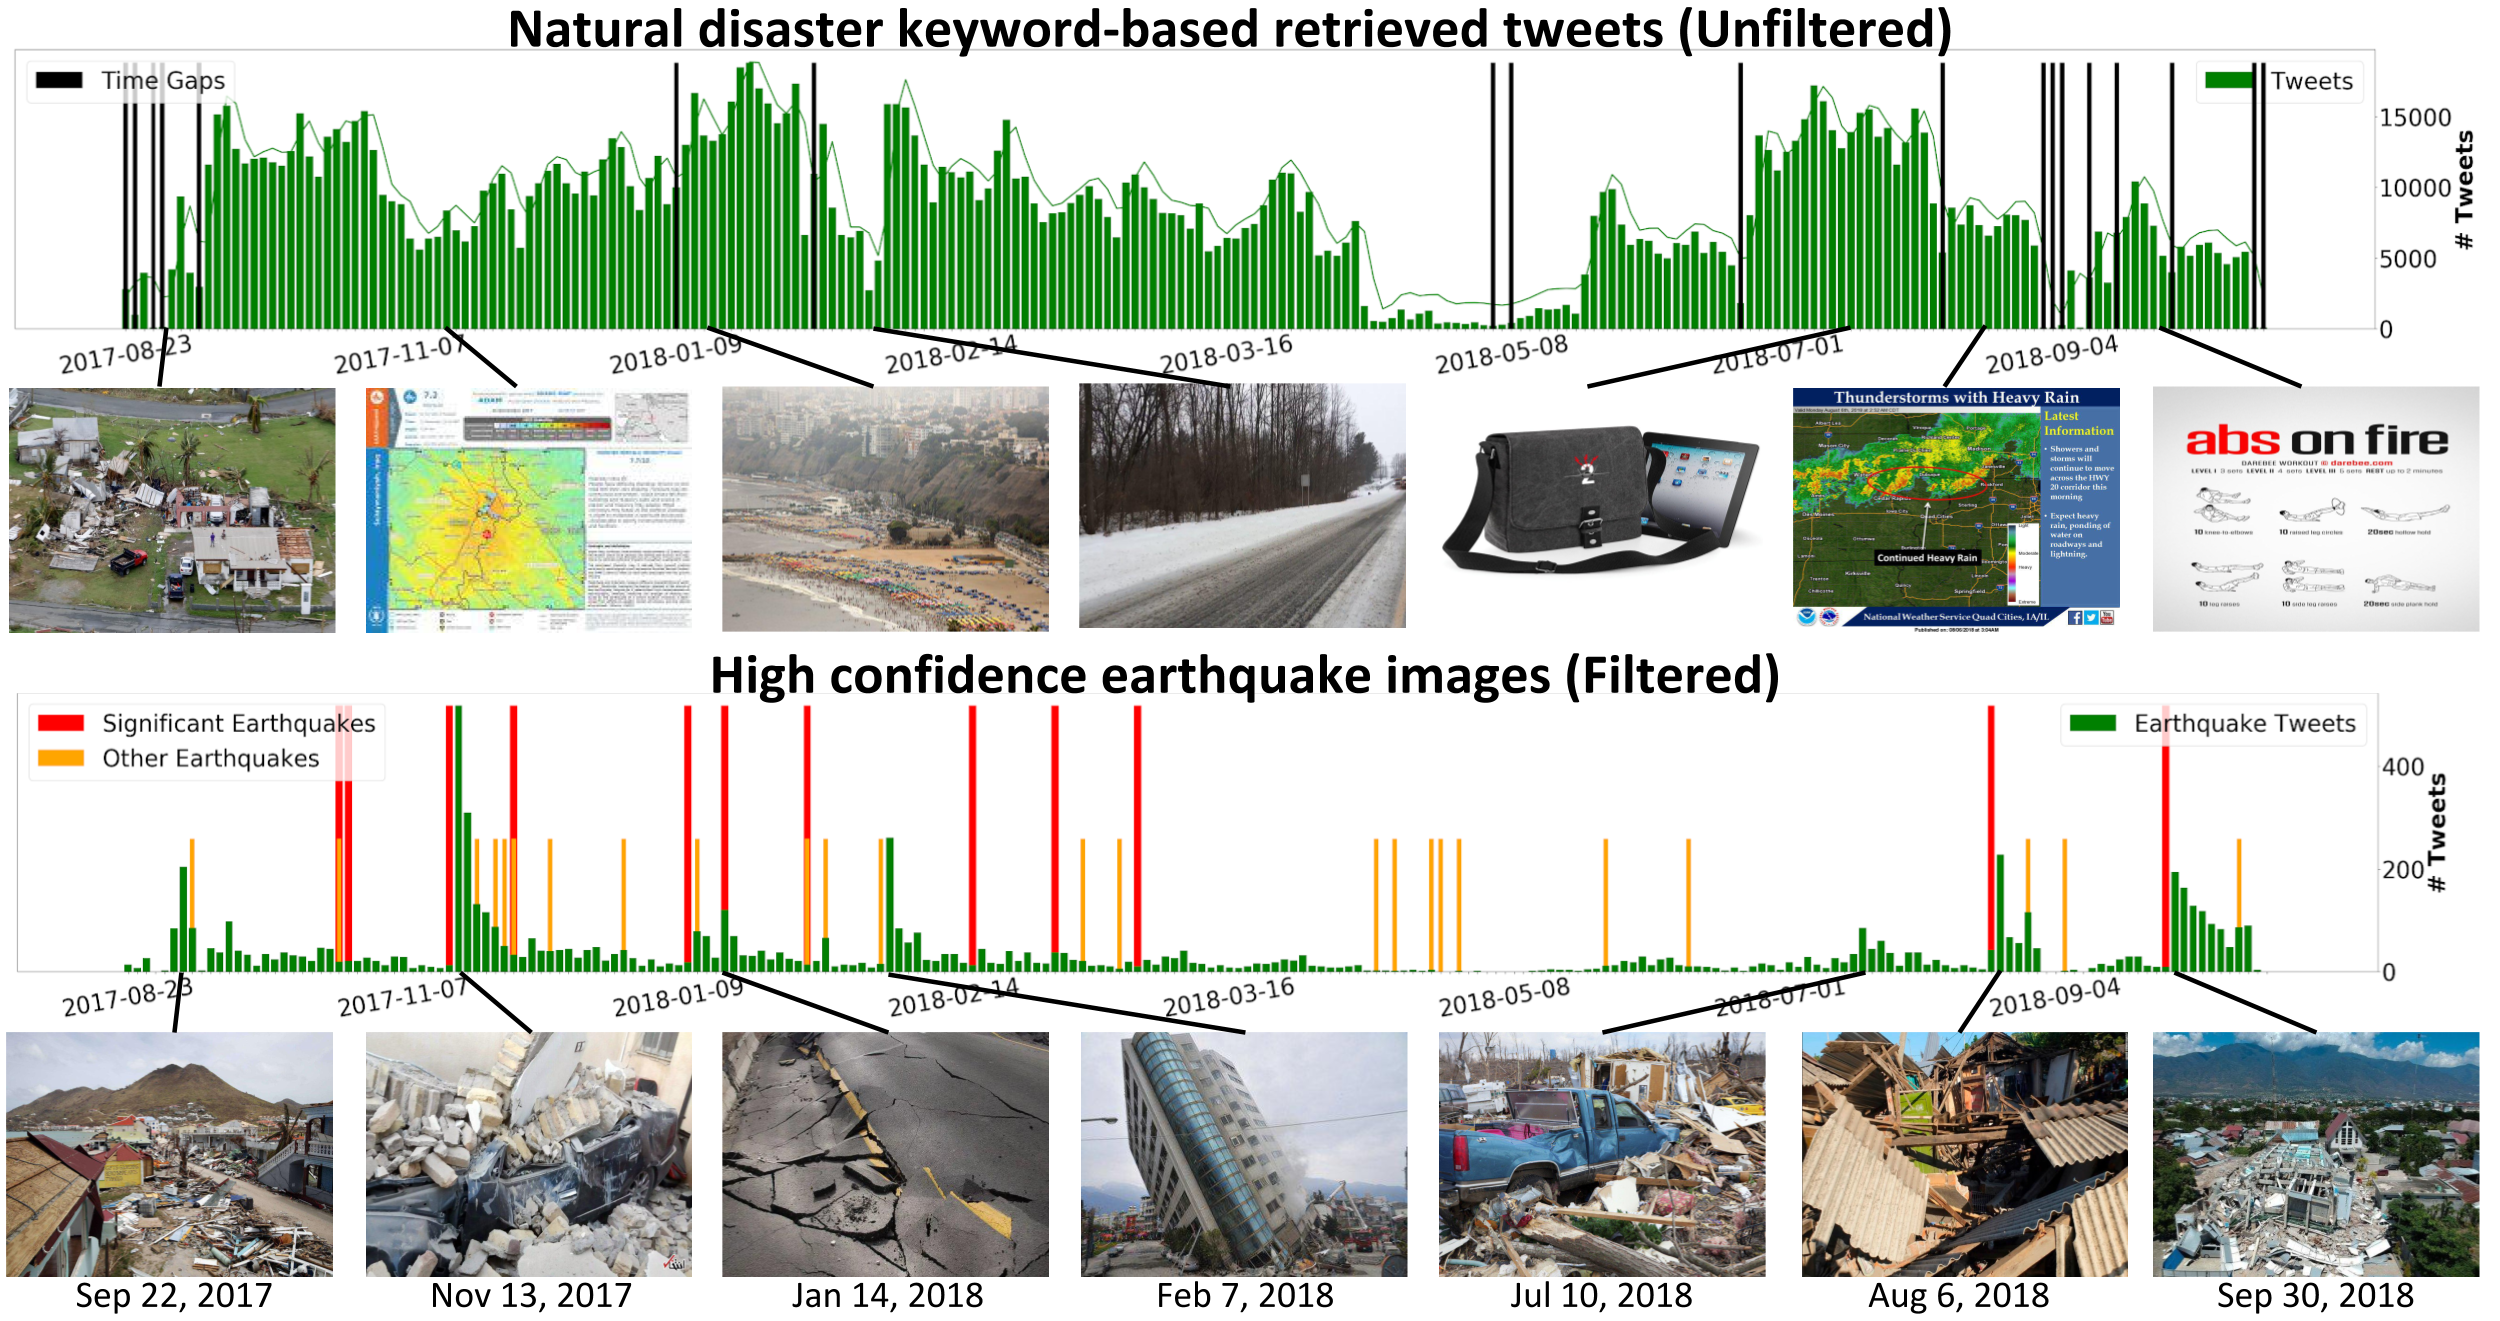
We examine how our incident detection model, trained with class-negative loss, performs in different real-world scenarios using millions of images collected from two popular social media platforms: Twitter and Flickr.
Upload an image to see the incident and place prediction!